
The famous management maxim, "If you can’t measure it, you can’t manage it," attributed to renowned business theorist Peter Drucker, has long served as a guiding principle for corporate executives. Today, this philosophy holds equally true for digital content creators, social media managers, and modern enterprises navigating the complex ecosystem of short-form video marketing. Growing an audience on platforms like TikTok requires far more than simply uploading creative content on a regular schedule; it demands a rigorous, data-driven approach to evaluating performance metrics, understanding audience behaviors, and recognizing systemic content patterns.

For many digital strategists, opening the TikTok analytics dashboard for the first time can feel akin to stepping onto a spaceship flight deck. The interface presents a dense array of changing numbers, percentage trends, and visual graphs, leaving many users wondering where to begin. However, digital marketing analysts emphasize that success does not require tracking every available data point. Instead, sustainable growth comes from focusing on the right metrics—those that directly illuminate audience demographics, content resonance, and overarching channel development.
Understanding TikTok Analytics and Its Evolution
TikTok analytics refers to the comprehensive data suite integrated directly into a user’s account, designed to provide deep insights into how published content performs within the platform’s recommendation algorithm. These metrics help publishers identify their core audience segments, measure engagement levels across different video styles, and pinpoint exact periods of peak user activity.
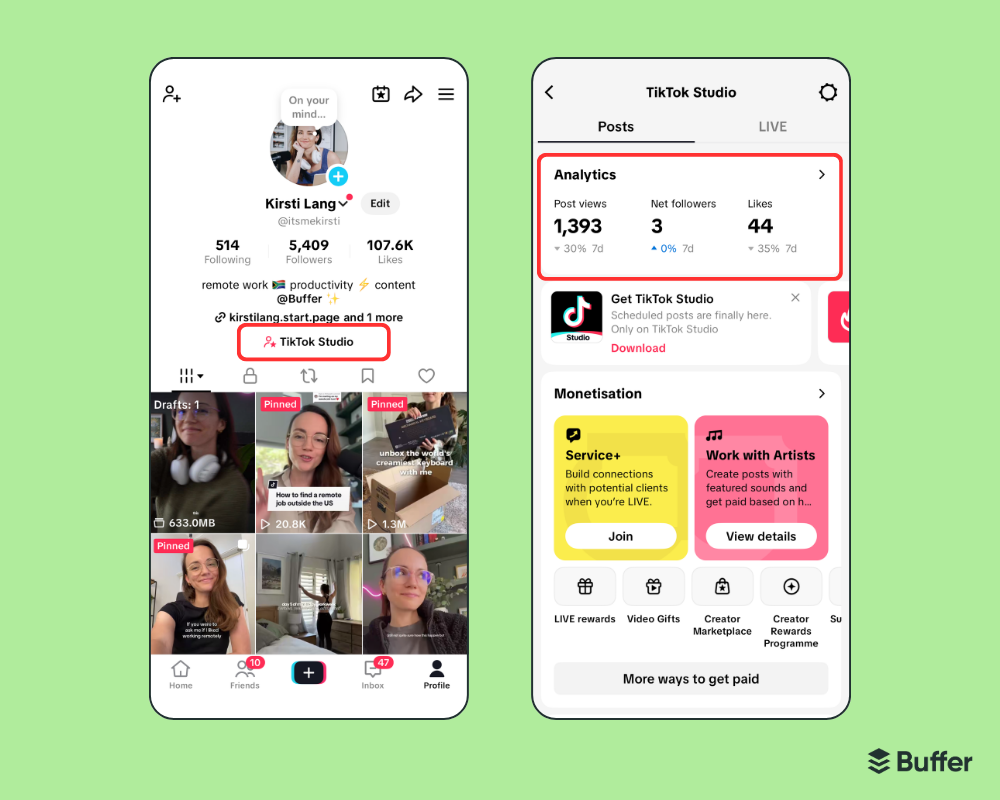
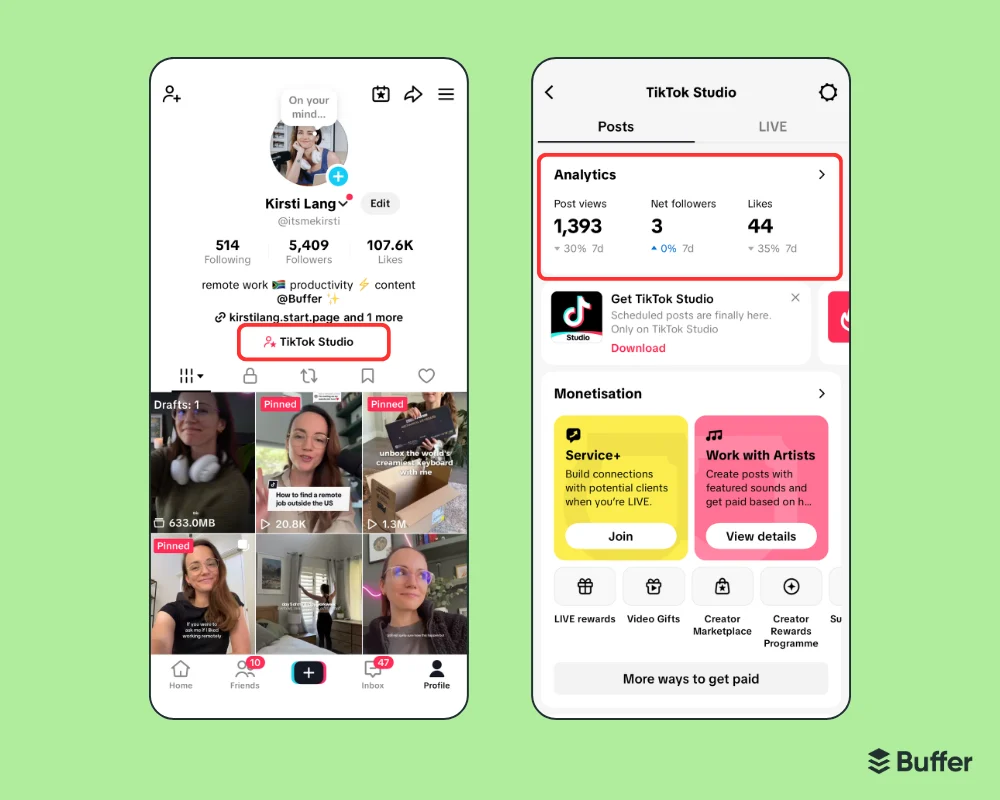
By analyzing these numerical insights, creators and commercial brands acquire the empirical foundation necessary to refine their production strategies, expand their organic reach, and, in many cases, monetize their digital presence. Over the years, TikTok has systematically upgraded its backend dashboards—transitioning from basic mobile metrics to the more robust TikTok Studio environment. This evolution reflects the platform’s maturation into a dominant global marketing channel where both independent creators and multinational corporations allocate significant advertising and organic content budgets.
Account Prerequisites and Dashboard Accessibility
Accessing TikTok’s native analytics suite requires specific account configurations. The analytics dashboard is exclusively available to users operating either a Creator account or a Business account. Individuals currently utilizing a standard personal profile can transition to an analytics-enabled account at no cost through the mobile app’s settings menu by navigating to Settings and Privacy, selecting Account, and opting to switch to a Business or Creator account.
Furthermore, while basic performance data is accessible immediately upon switching account types, certain granular features—such as detailed follower demographic tabs—require a minimum threshold of 100 followers before data generation begins.
Platform accessibility varies between mobile and desktop environments, offering distinct advantages depending on the user’s operational workflow:
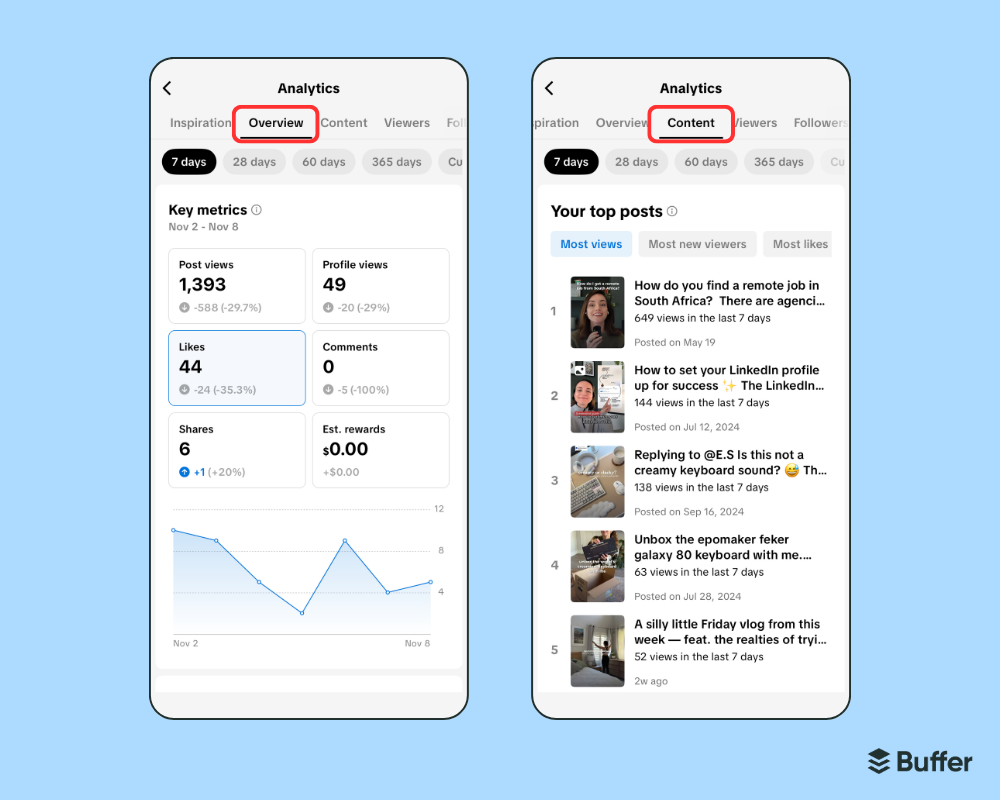
- Mobile App Interface: Optimized for rapid, on-the-go checks, the mobile application provides compact graphs and touch-based, swipeable views. While convenient for daily monitoring, data export options are limited primarily to screenshots or third-party integrations.
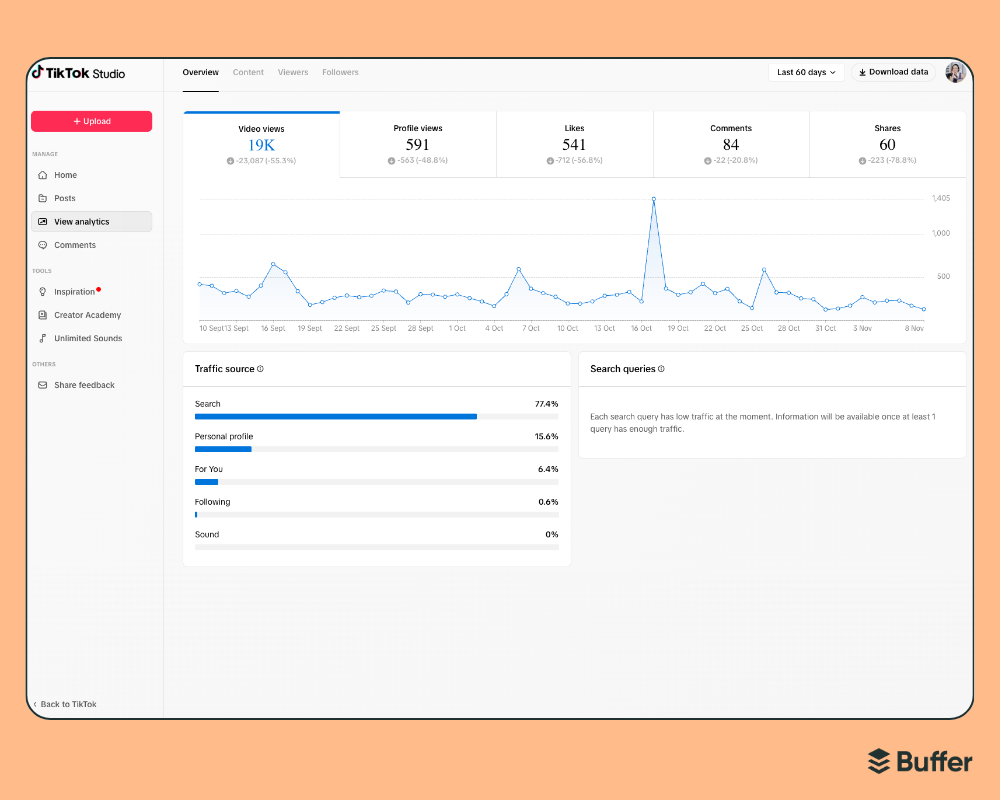
- Desktop Interface: Accessible via TikTok Studio on desktop web browsers, this environment is engineered for comprehensive analysis and multitasking. It features larger, detailed graphs, clickable tabs, dropdown menus, and crucial direct export options, such as downloading performance data as CSV files for advanced offline analysis.
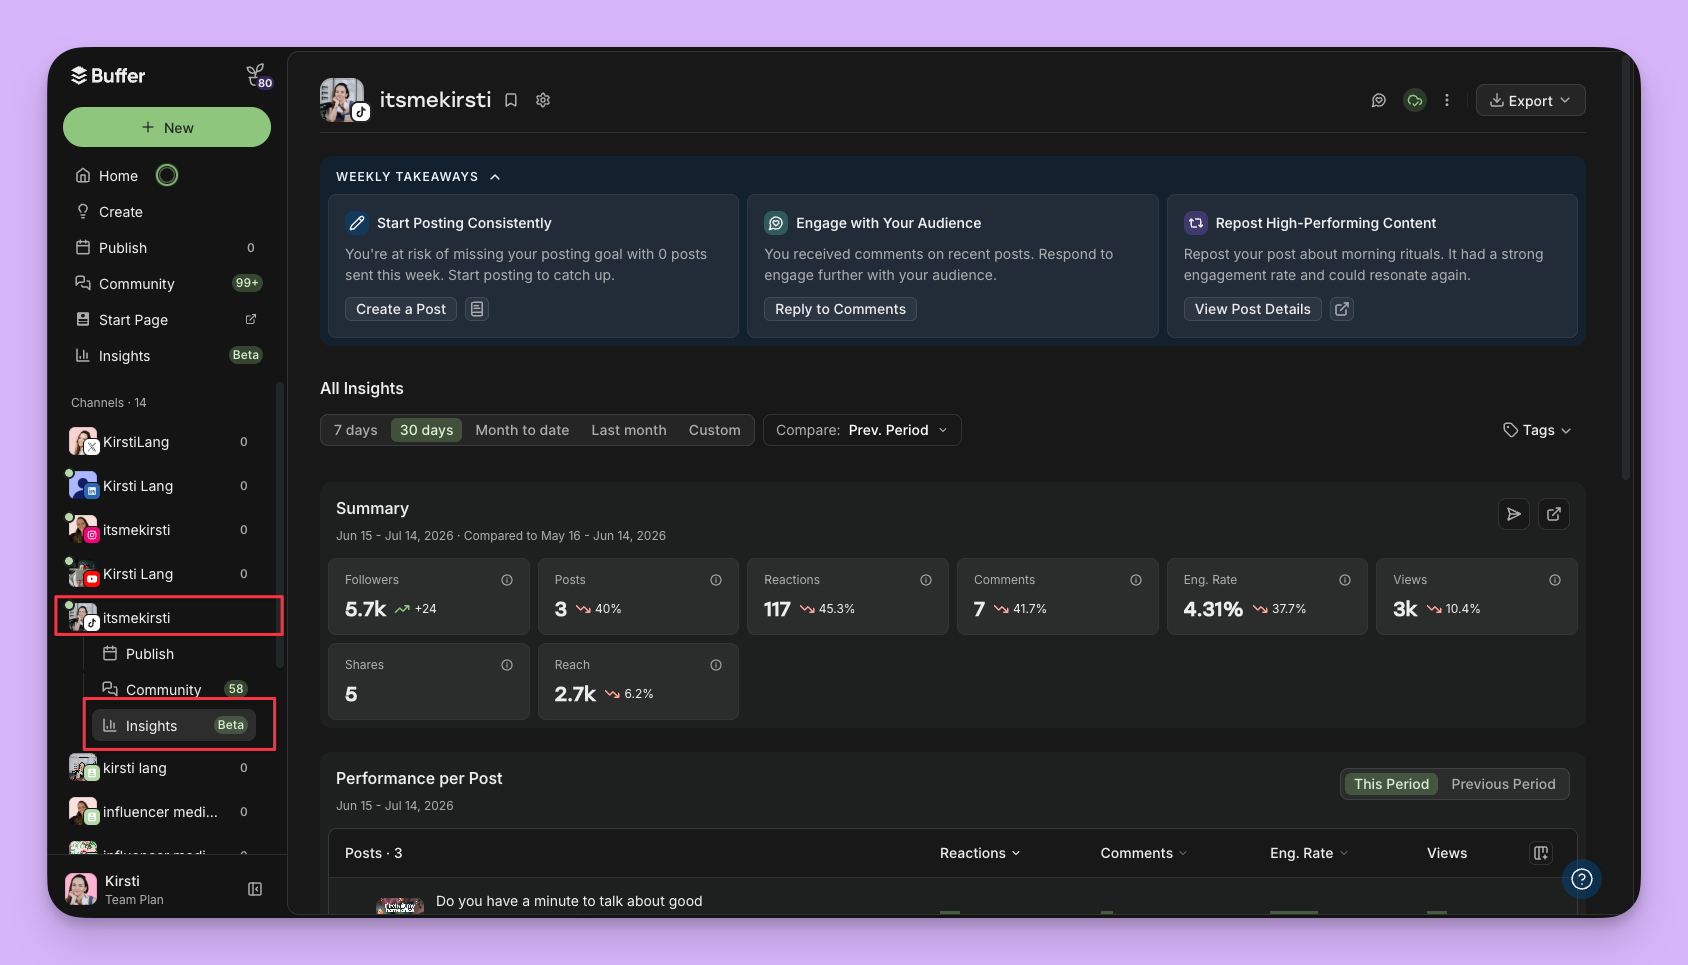
For organizations managing multiple social media channels simultaneously, cross-platform tools like Buffer Insights offer a centralized dashboard. These integrations aggregate follower growth, reaction metrics, and impression rates across networks while providing automated performance breakdowns and AI-powered weekly summaries to streamline multi-channel management.
Deconstructing the Four Core Analytics Sections
TikTok organizes its native analytics infrastructure into four primary categories: Overview, Content, Followers, and LIVE. While the structural framework remains consistent across account types, the depth and strategic focus of the data differ between Creator and Business accounts.
1. Overview
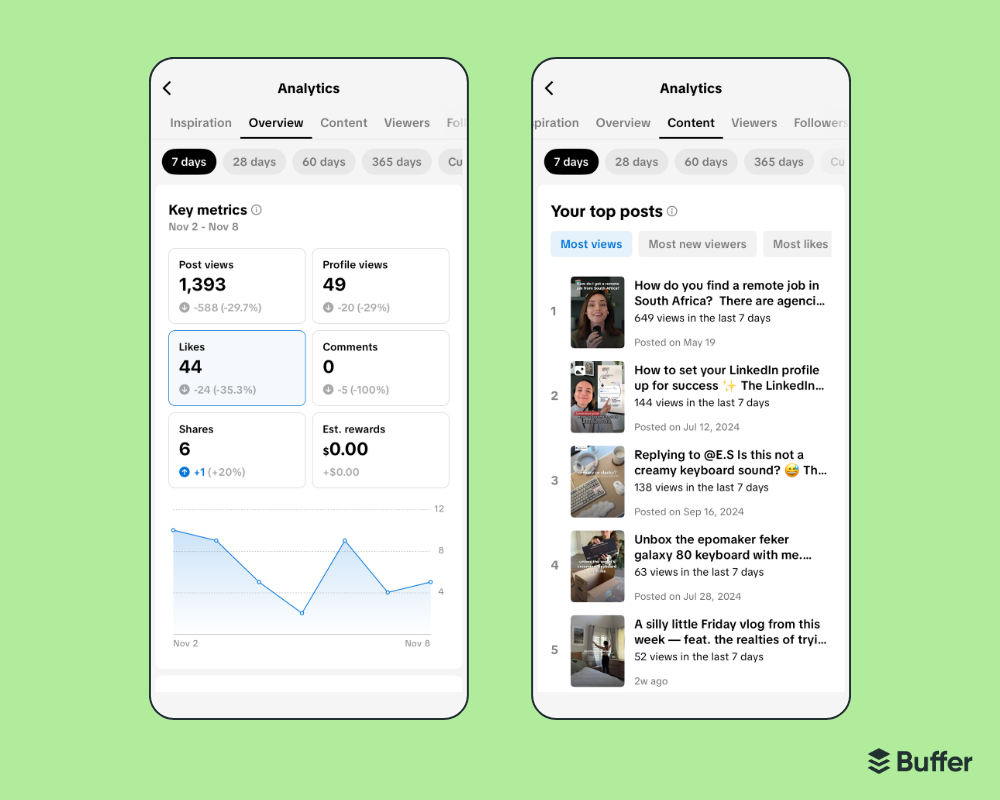
The Overview section provides a high-level executive summary of account performance over a selected timeframe, typically ranging from 7 to 60 days. Key metrics include total video views, profile page views, net follower growth, and overall engagement rates. Digital strategists utilize this section as a baseline barometer to evaluate general channel health and identify sudden upward or downward anomalies that warrant deeper investigation.
2. Content
Zooming in from macro-level account statistics, the Content tab evaluates the performance of individual video assets. Important performance indicators tracked here include total views, likes, shares, comments, watch time, and audience retention rates. Because certain individual post metrics are only retained for a rolling seven-day window, regular auditing is essential to prevent data loss. Creators leverage this tab to identify emerging content formats and narrative hooks that successfully capture viewer attention.
3. Followers
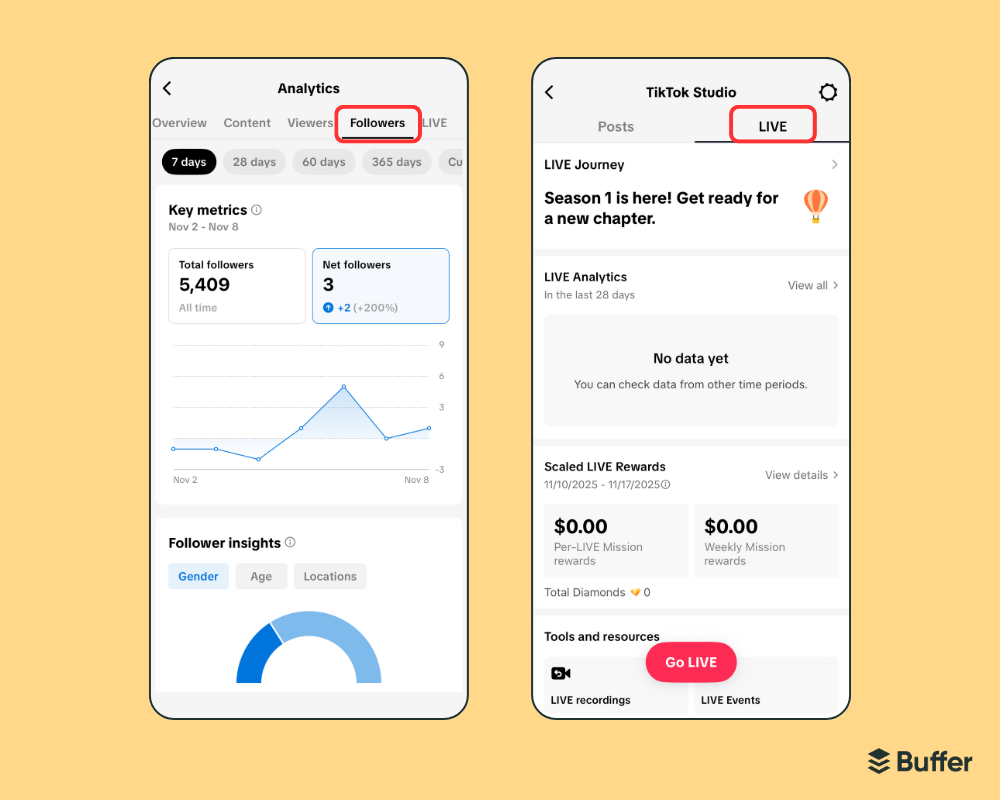
The Followers tab serves as a demographic and behavioral repository, detailing who is watching the content, their geographic locations, age distributions, gender splits, and precise hours of peak platform activity. By cross-referencing these insights with publishing schedules, marketers can align their content distribution windows with periods when their specific audience segment is most actively engaged online.
4. LIVE
Dedicated exclusively to real-time broadcasting, the LIVE tab measures metrics generated during live-stream sessions. Data points include total peak viewers, unique viewers, new followers acquired during the broadcast, total diamonds earned, and average watch duration. Broadcasters treat these analytics as a real-time feedback loop, examining viewer drop-off timestamps to refine the pacing and structure of future live events.
Five Critical Metrics Every Creator Should Monitor
While dashboards display dozens of individual data points, industry analysts recommend focusing primarily on five core metrics to drive strategic decision-making:
- Video Views: Measures the aggregate volume of times content has been watched. Tracking views helps identify which topics or creative angles possess the widest broad-market appeal.
- Watch Time: Tracks the duration users spend engaging with a video. Low watch time signals a weak opening hook or flagging narrative momentum, prompting creators to tighten their video editing or front-load their most compelling messaging into the first three seconds.
- Follower Growth and Followers Per Video: Evaluates how effectively individual pieces of content convert casual viewers into permanent subscribers, highlighting high-performing conversion assets.
- Engagement (Shares and Saves): While likes demonstrate passive appreciation, metrics like shares and saves indicate high utility and viral potential, showing that users find the content valuable enough to distribute to external networks or archive for future reference.
- Follower Active Hours: Identifies the exact time zones and hours when an account’s unique audience is browsing the platform, ensuring optimal timing for new content deployment.
Translating Analytics into a Strategic Content Framework
Effective data analysis requires moving beyond a scorecard mindset and treating analytics as an ongoing creative feedback loop. When a specific video outperforms baseline metrics—particularly in shares and saves—publishers should conduct a forensic review of the asset. Analyzing the structural elements, the nature of the comment section, and the underlying subject matter allows content teams to replicate success systematically.
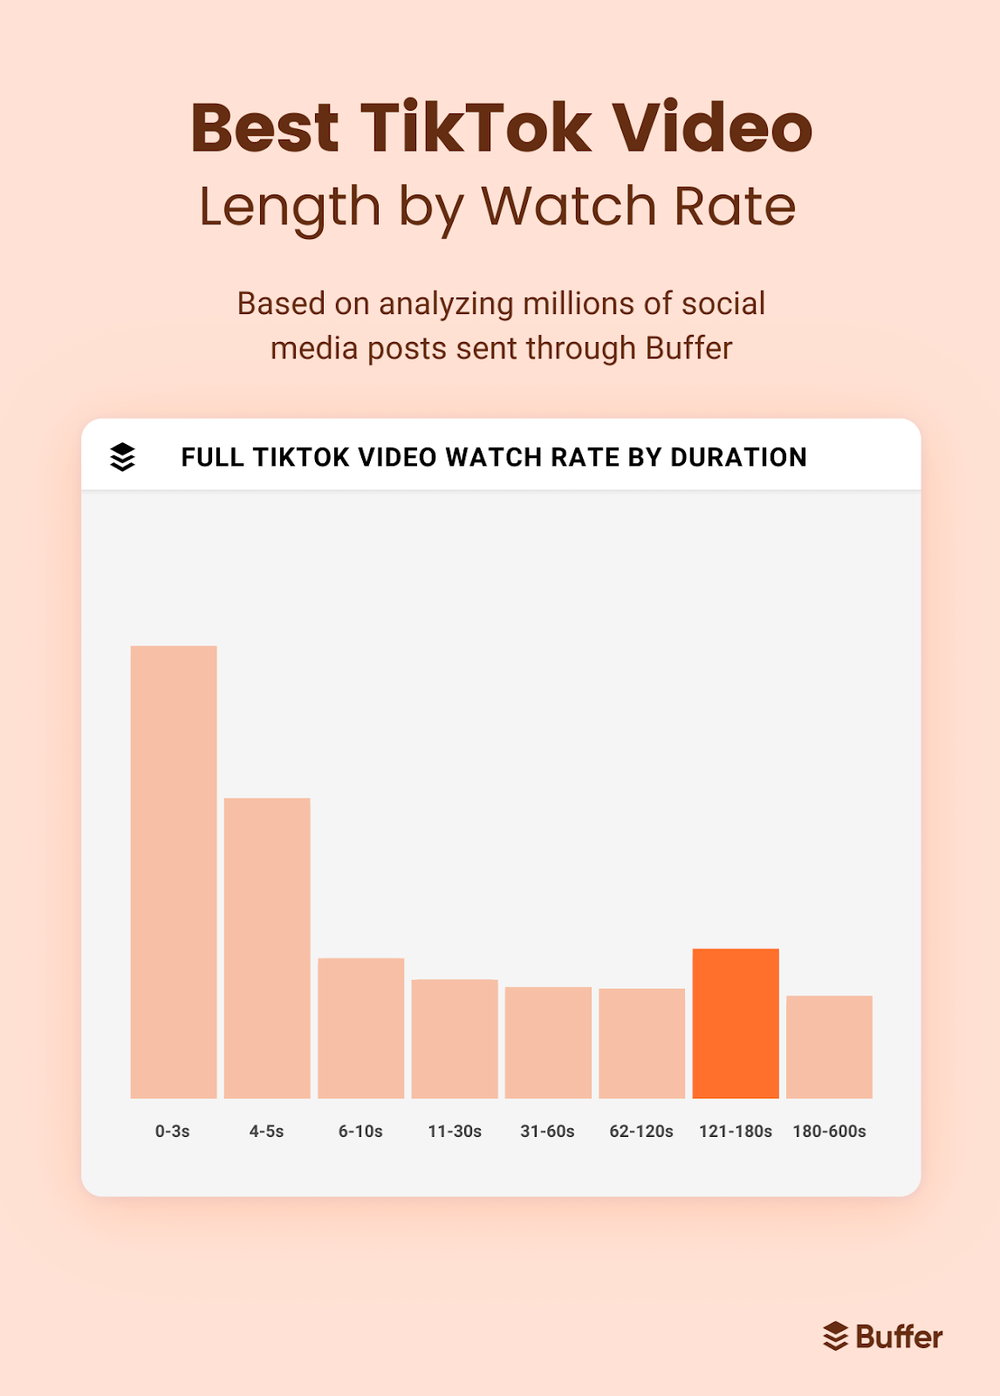
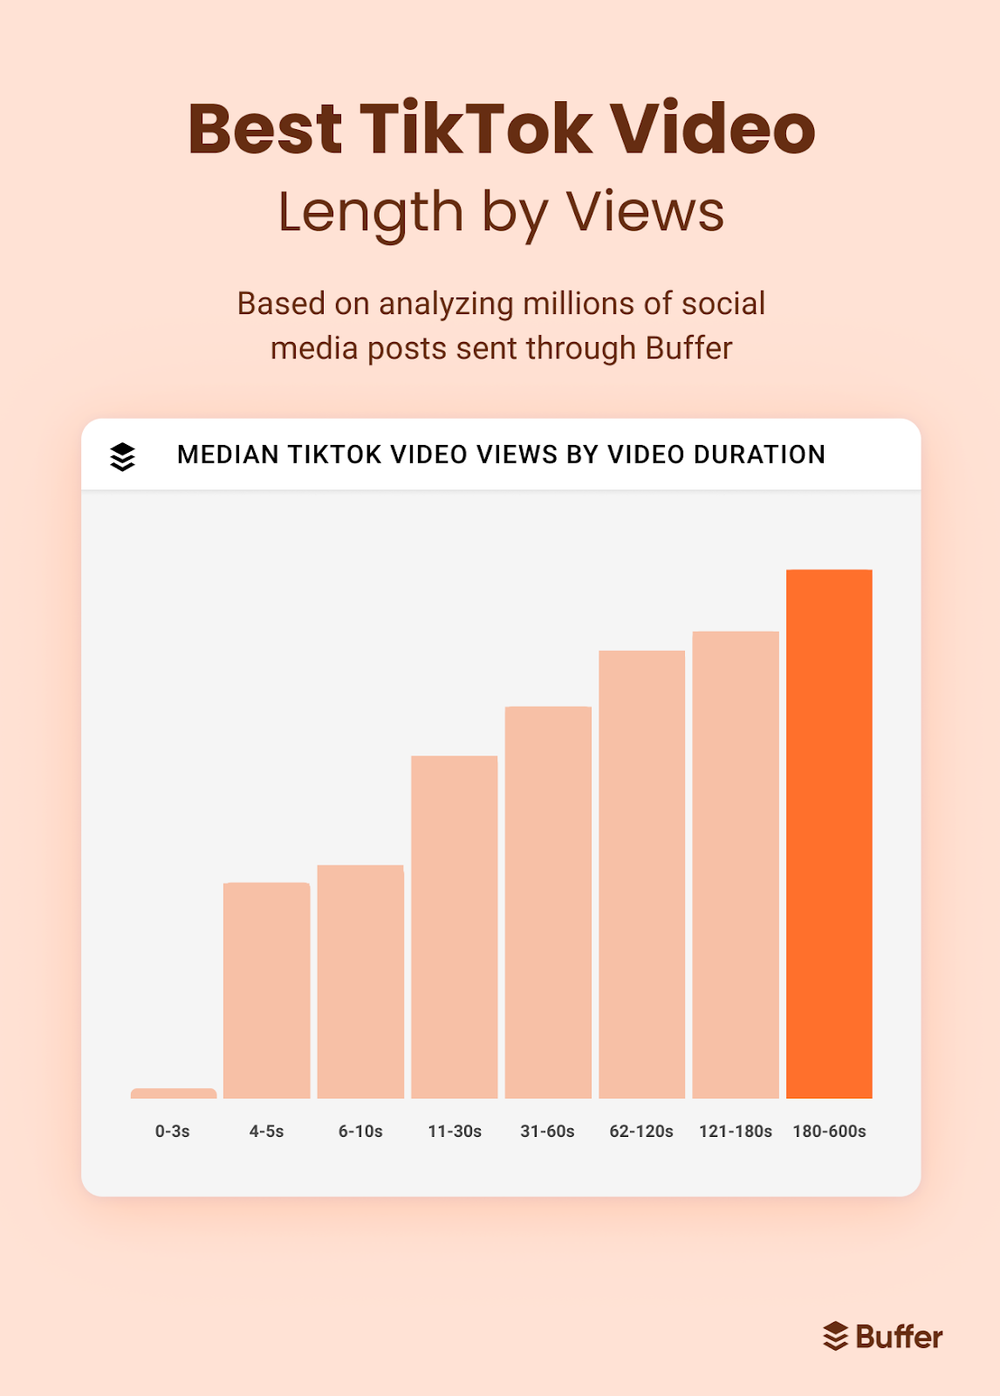
Furthermore, platform algorithms and user consumption habits continue to evolve. Recent industry analyses indicate a notable shift in user engagement patterns regarding video duration. While short, punchy clips historically dominated short-form platforms, contemporary algorithmic data demonstrates that well-structured, longer-form videos spanning three to ten minutes frequently achieve high watch rates and substantial median view counts, provided the subject matter justifies the extended length.
Establishing Goals and Implementing Test-and-Learn Protocols
Analytics remain largely ineffective without clearly defined organizational objectives. Content strategists typically categorize their goals into distinct operational pillars, each mapped to specific performance metrics:
- Brand Awareness: Measured primarily through video views, unique reach, and profile visits.
- Community Building: Evaluated via net follower growth, comment volume, and audience retention curves.
- Direct Engagement: Focused heavily on shares, saves, and interaction rates.
To maintain algorithmic competitiveness, top-performing creators routinely execute structured test-and-learn methodologies. By systematically varying experimental variables—such as testing different visual hooks, altering video pacing, experimenting with audio selection, and varying publishing times—brands can isolate performance drivers and adapt swiftly to shifting platform dynamics.
Ultimately, TikTok analytics bridge the gap between creative intuition and empirical reality. By establishing regular auditing habits, interpreting audience behavior accurately, and integrating centralized management solutions when necessary, digital publishers can transform raw data into a reliable roadmap for sustained audience development.