
As management theorist Peter Drucker famously observed, if you cannot measure something, you cannot manage it. In the contemporary landscape of digital content creation, this maxim applies acutely to short-form video platforms. Growing an audience on TikTok requires moving past the intuitive posting of video content to conduct rigorous analysis of performance metrics. However, for many creators and brands, opening the TikTok analytics dashboard for the first time resembles inspecting a complex instrument panel filled with dense numerical data, percentages, and performance graphs.

Navigating this influx of information successfully depends not on measuring every available variable, but on isolating key performance indicators that align with specific growth objectives. By focusing on metrics that provide actionable intelligence regarding audience behavior, content efficacy, and channel trajectory, creators can transform raw data into a structured strategy.
Understanding TikTok Analytics and Native Infrastructure
TikTok analytics refers to the collective quantitative data provided within an account interface that measures how content resonates across the platform. This statistical overview illuminates audience demographics, engagement patterns, and optimal broadcast windows. Accessing this data equips content creators and commercial enterprises with the empirical foundation necessary to refine production values, expand viewer reach, and monetize digital assets.
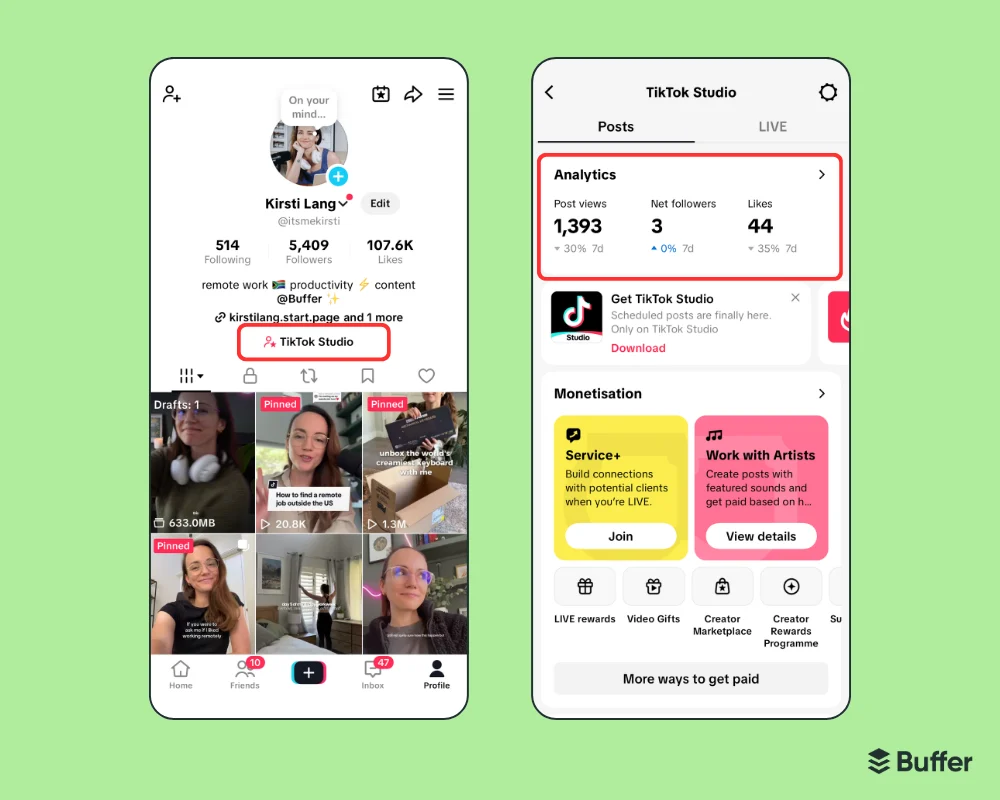
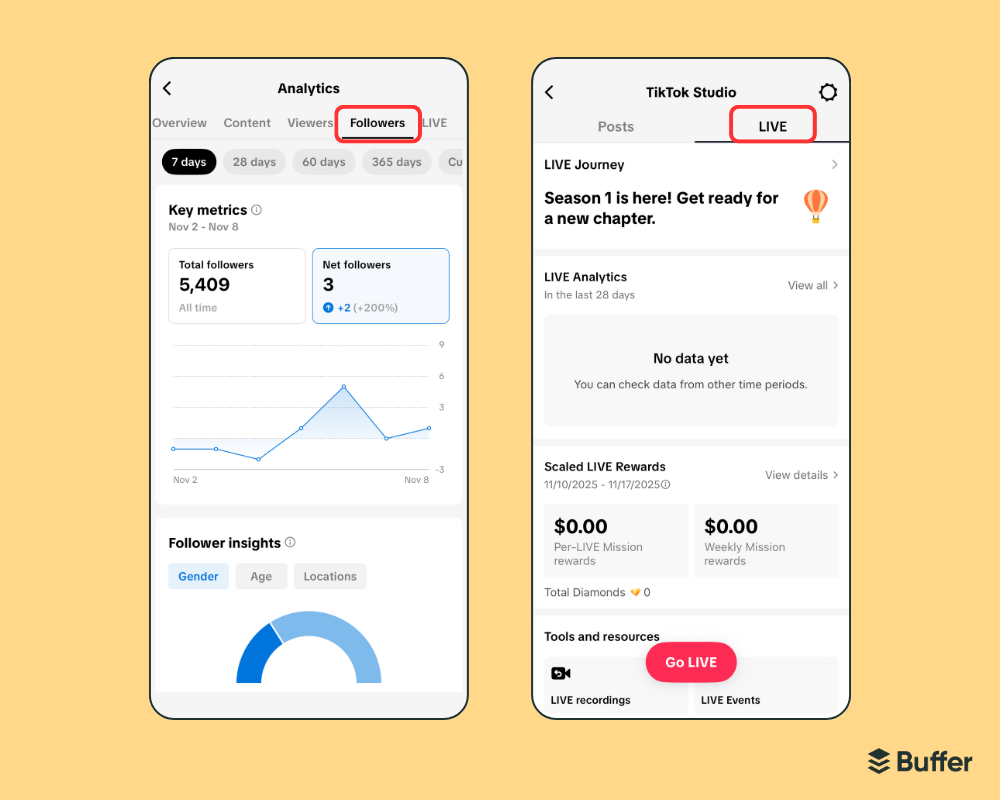
To utilize native analytics tools, users must migrate from a standard personal profile to either a Creator or a Business account. This transition is executed without cost directly within the mobile application by navigating through Settings and Privacy, selecting Account, and opting to switch account types. While foundational analytics are immediately accessible upon switching, certain advanced features—most notably the dedicated Followers tab—require a minimum threshold of 100 followers before demographic data begins populating.
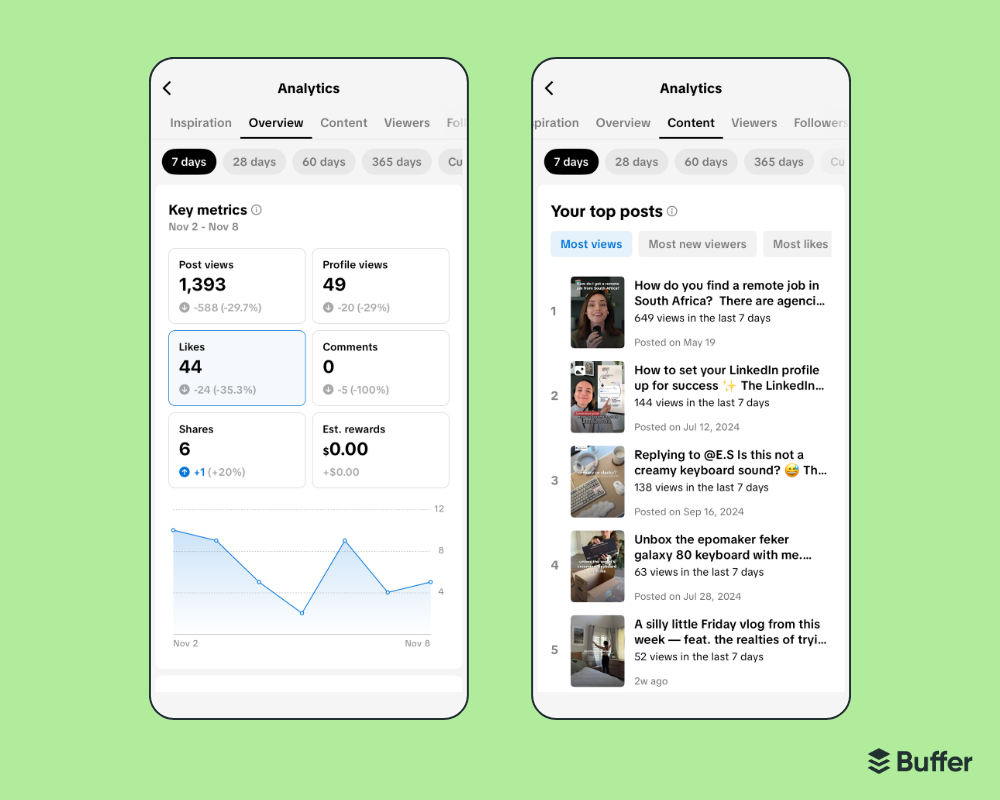
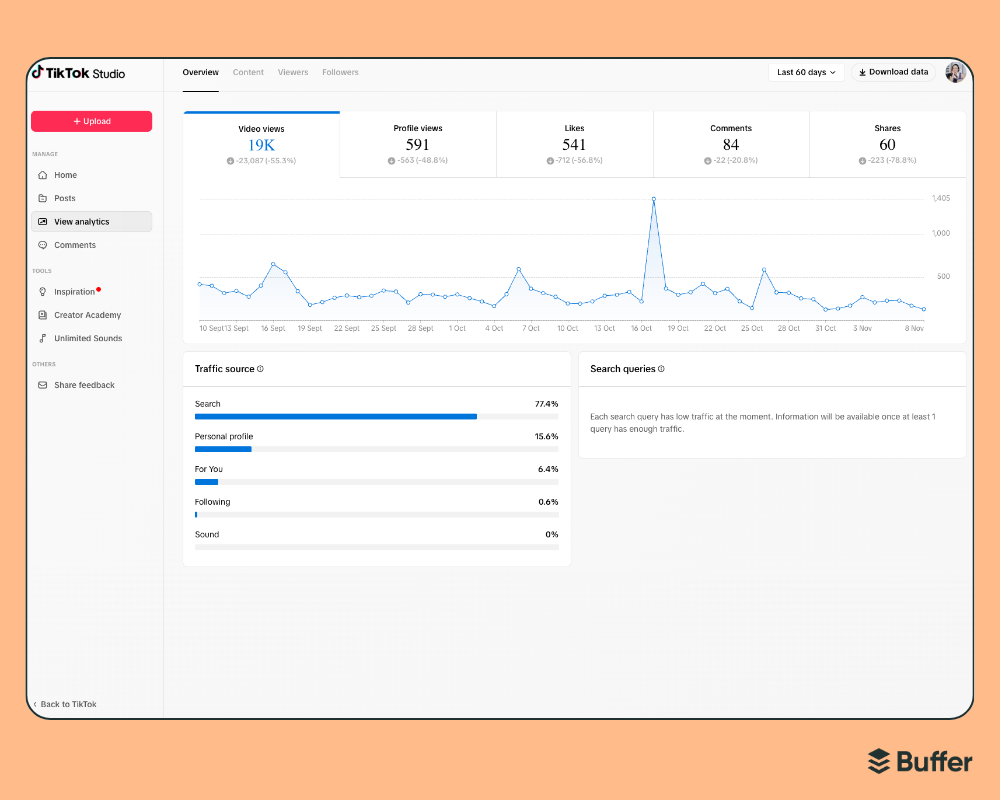
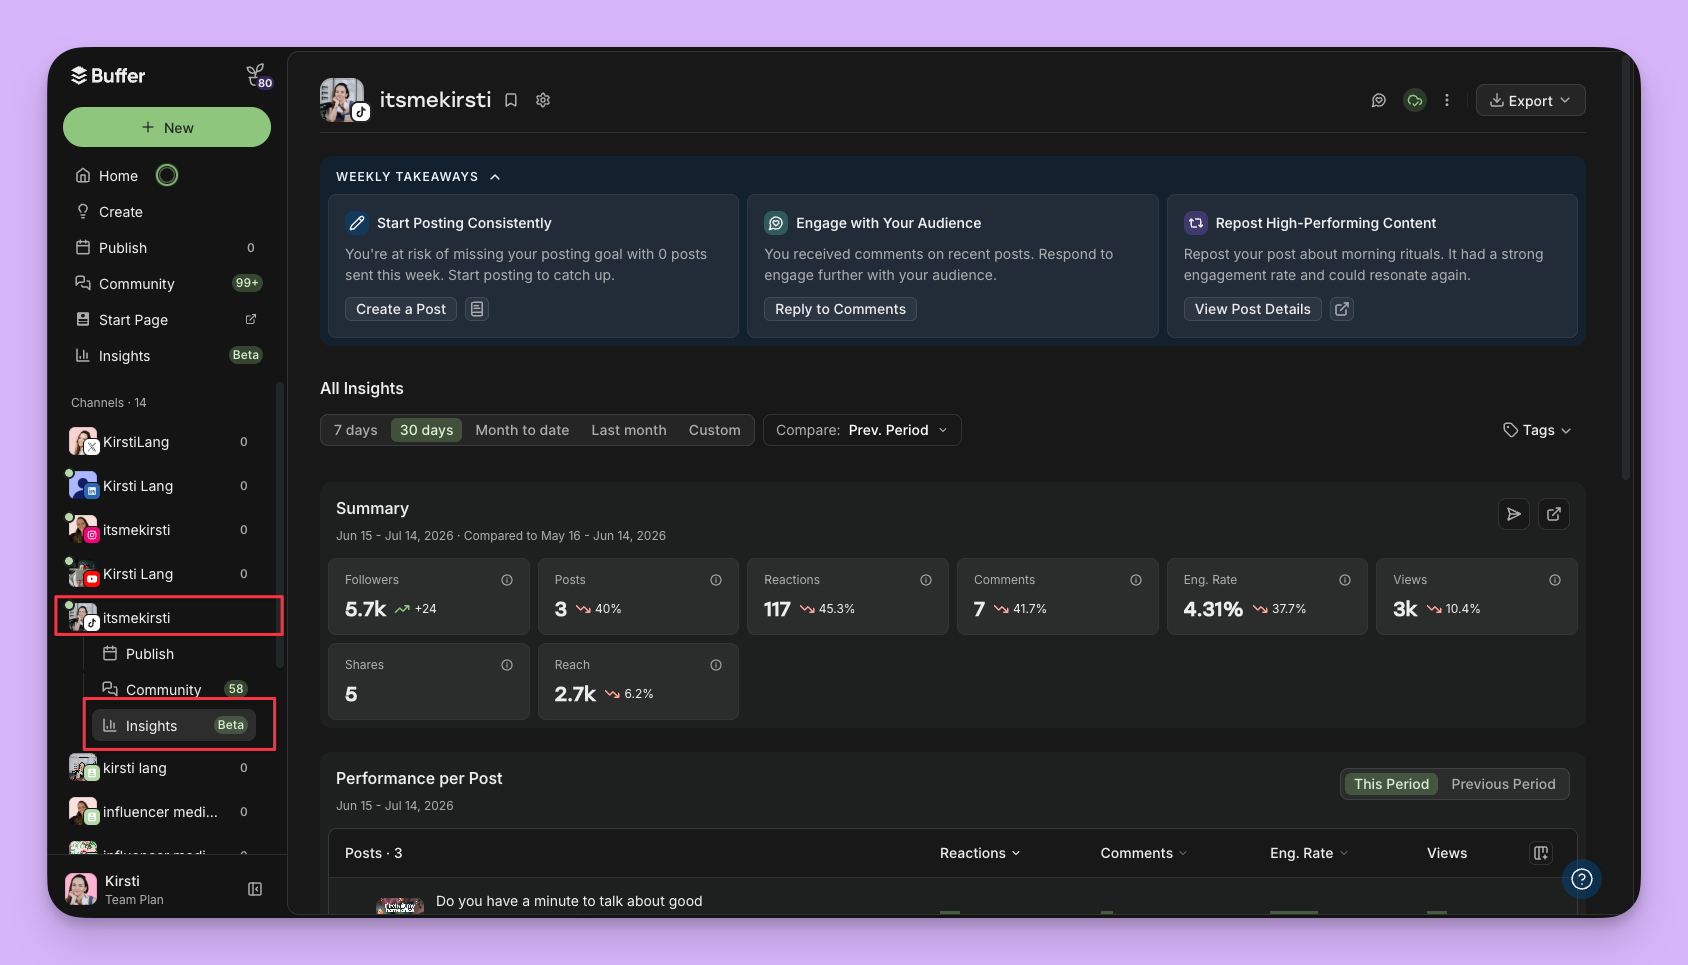
Platforms offer distinct environments for data review, dividing functionality between mobile applications and desktop web browsers. The mobile application, accessed via the TikTok Studio interface directly beneath a user profile, provides optimized, touch-based navigation designed for rapid performance checks. Conversely, the desktop analytics portal at tiktok.com/analytics delivers comprehensive data visualization, interactive tabs, and the capability to export metrics directly into CSV format for advanced spreadsheet analysis. For multi-channel managers, third-party aggregation tools such as Buffer Insights centralize these data streams alongside other social platforms, offering automated weekly takeaways to streamline cross-channel strategy.
The Core Architectural Sections of the Dashboard
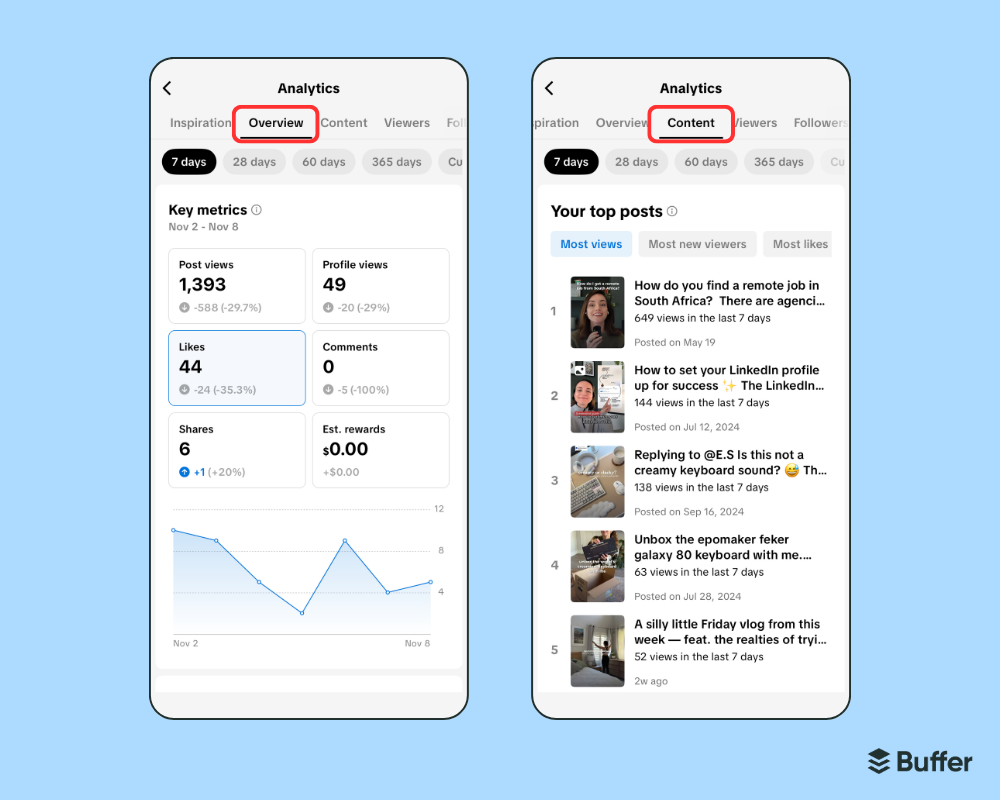
TikTok categorizes native performance data into four primary sections: Overview, Content, Followers, and LIVE. Although these four divisions remain consistent across account types, the analytical depth varies depending on whether an account is registered as a Creator or a Business entity.
The Overview section serves as a high-level executive summary, tracking macro metrics such as cumulative video views, total profile visits, and net follower growth across defined timeframes spanning seven to sixty days. Sudden anomalies or trend shifts observed in this section act as diagnostic triggers, prompting creators to investigate deeper layers of the data ecosystem.
The Content section narrows its focus to individual video assets. Performance metrics tracked here include total views, individual like counts, comment volumes, share distributions, and audience retention graphs. Because granular data for specific posts is frequently restricted to a rolling seven-day window, regular monitoring is essential to prevent data loss.
The Followers section houses audience intelligence, profiling the demographic composition of a community. This includes aggregated data regarding viewer age ranges, primary geographic locations, gender distributions, and hourly active-time distributions.
Finally, the LIVE tab compiles metrics dedicated to real-time broadcasting sessions. It records peak concurrent viewership, total broadcast duration, net diamond revenue, and engagement interactions generated during live-stream events.
Five Critical Metrics for Strategic Growth
While the dashboard provides dozens of data points, sustainable audience expansion typically relies on monitoring five core metrics:
- Video Views: This metric records the total number of times a piece of content has been played. Monitoring view counts across different subjects helps isolate high-performing content verticals.
- Watch Time: This evaluates audience retention, illustrating whether viewers consume content to completion, abandon clips early, or replay specific segments. Low watch times indicate a need for stronger opening hooks or accelerated editing pacing.
- Follower Growth and Conversion: This metric tracks the net change in community size alongside the specific ratio of new followers generated per published video, helping creators identify which content formats successfully drive subscription behavior.
- Engagement Interactions: Comprising likes, comments, saves, and shares, this metric measures active audience participation. Shares are particularly valuable, as they signal content that viewers find sufficiently compelling to distribute to external networks.
- Follower Insights and Timing: Analyzing demographic details and active hours allows publishers to synchronize their publishing schedules with periods of peak audience availability.
Strategic Implementation and Optimization
Integrating analytics into a regular creative workflow converts the dashboard from a retrospective scorecard into a forward-looking feedback loop. Setting explicit objectives—such as brand awareness, community engagement, or direct conversion—allows creators to map specific key performance indicators to desired outcomes.
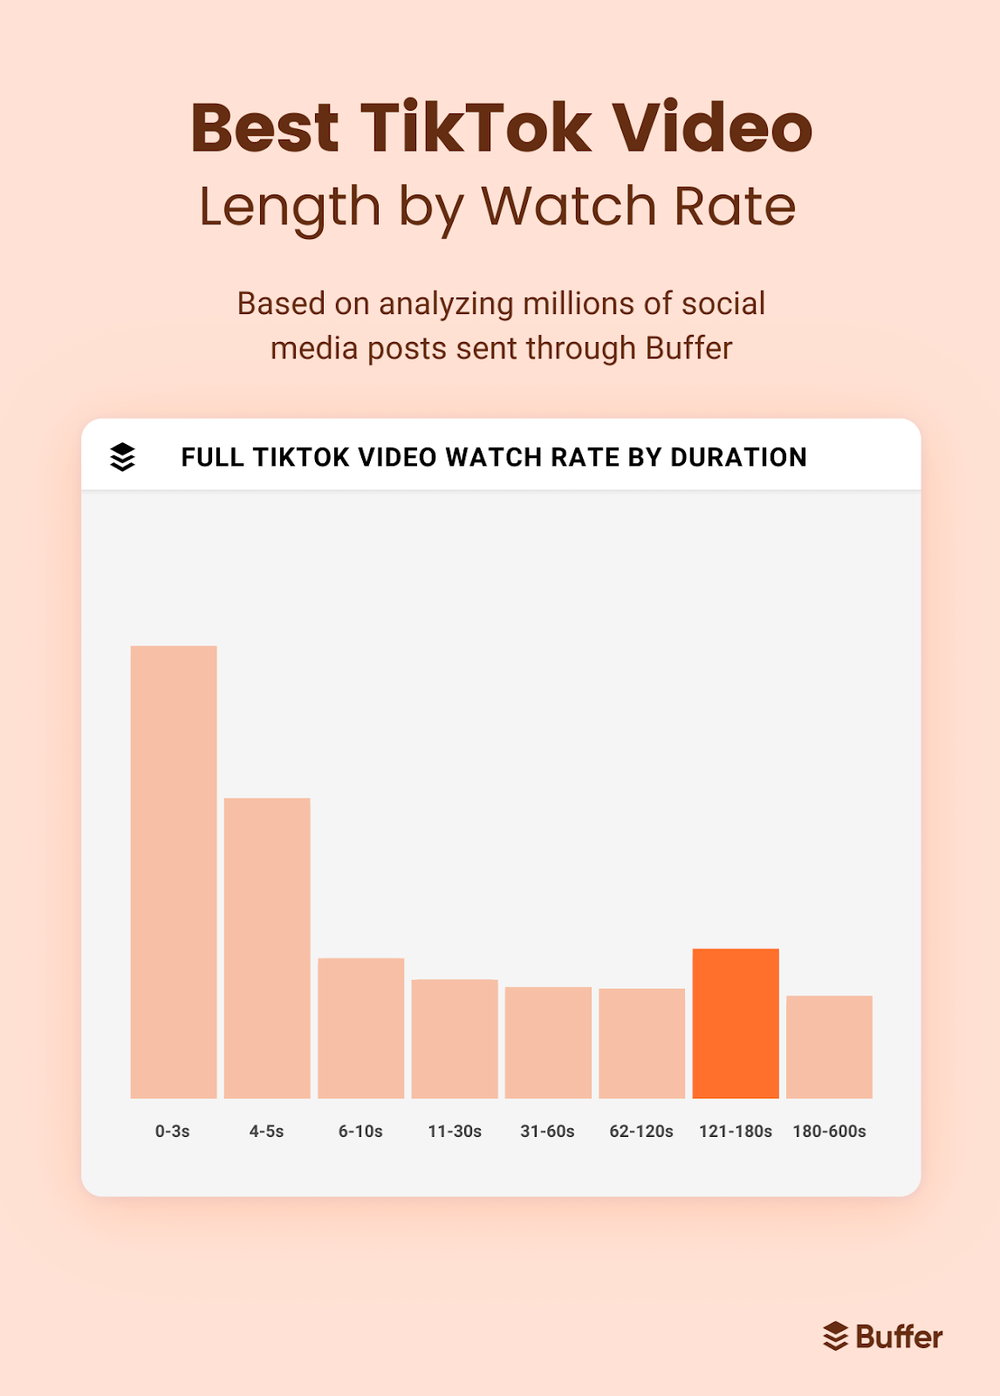
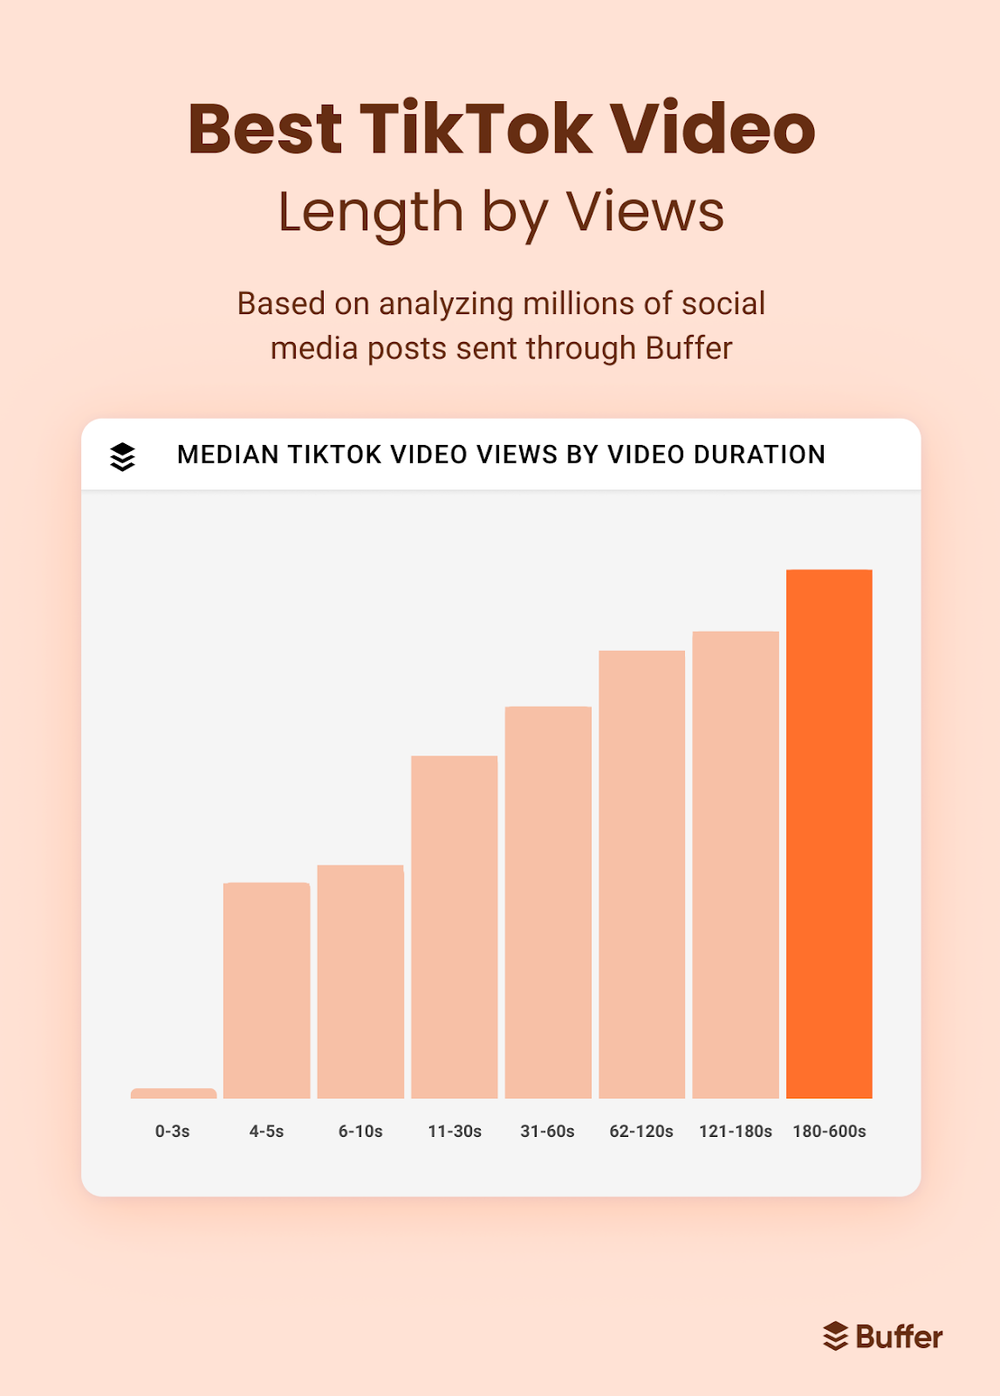
Industry research into content structuring reveals shifting consumption habits on the platform. Data analysis indicates that longer-form videos ranging from three to ten minutes frequently achieve high median view counts and robust watch times, challenging the early industry standard of hyper-short clips. However, strategic adjustments regarding video length must be balanced against brand context and audience tolerance.
Furthermore, empirical studies examining optimal posting times indicate that evening windows, particularly between 6:00 PM and 11:00 PM, often generate high median engagement rates across the platform at large. Nevertheless, creators are advised to prioritize their proprietary audience insights over generalized industry benchmarks, as niche communities frequently exhibit unique behavioral schedules.
Frequently Asked Questions
How do I see my analytics on TikTok?
On mobile, navigate to your profile, tap the TikTok Studio button beneath your bio, and select Analytics. On desktop, log into the dedicated analytics portal via web browser.
What does "Other" mean in traffic sources?
The "Other" traffic category accounts for views originating from outside TikTok’s primary algorithmic feeds, including external web links, embedded video players, and direct messaging shares.
How many followers are required to view audience demographics?
Accessing detailed follower demographics and active-time charts requires a minimum threshold of 100 followers on a Creator or Business account.
What is the update frequency for analytics data?
Performance data undergoes periodic processing rather than instantaneous updating. Creators are advised to allow a minimum window of 24 hours post-publication before conducting final performance evaluations.